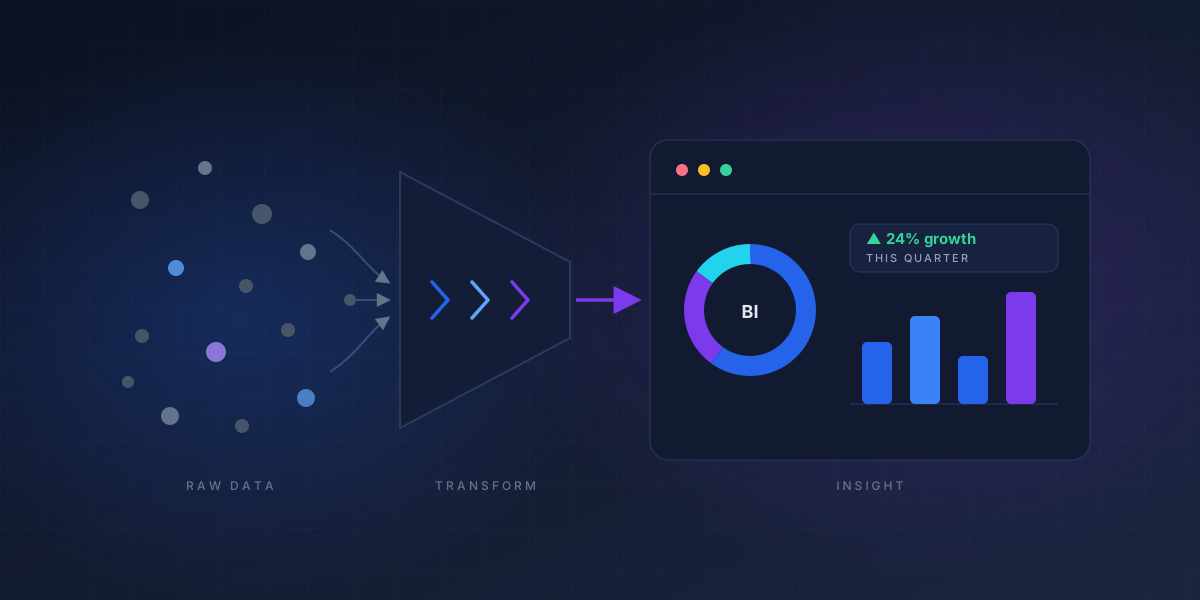
Every business generates data. Sales numbers, customer interactions, website traffic, inventory levels, employee performance - it all piles up. The question isn't whether you have data. It's whether you can actually use it.
That's where business intelligence comes in. And no, it's not just a buzzword that consultants use to sound important. BI is the set of tools, processes, and practices that turn your raw data into something you can actually act on.
In this guide, we'll break down what business intelligence really means, how it works, the tools behind it, and how companies are using it to make better decisions every day.
What Business Intelligence Actually Means
At its core, business intelligence is the process of collecting data from across your organization and turning it into actionable insights that help leaders make better, faster decisions.
Think of it this way: your sales team knows how much they sold last month. Your marketing team knows how many leads came in. Your operations team knows how much inventory you have. But can you look at all of that together and answer questions like "Which products are most profitable?" or "Where should we invest next quarter?"
Business intelligence connects those dots. It pulls data from different systems - your CRM, your ERP, your spreadsheets, your databases - and puts it into dashboards and reports that tell a clear story.
The Simple Definition
Business intelligence (BI) is the practice of turning raw business data into visual reports, dashboards, and insights that help organizations understand what's happening, why it's happening, and what to do about it.
BI isn't about having the fanciest technology. It's about having the right information at the right time so you can make decisions based on facts instead of gut feelings.
How Business Intelligence Works
Behind every good BI dashboard is a process that moves data from where it lives to where it's useful. Here's the typical flow:
- Data Collection - Information is gathered from multiple sources: databases, spreadsheets, cloud applications, APIs, and even manual inputs.
- Data Storage - The collected data is stored in a central location, often a data warehouse or data lake, where it can be organized and accessed consistently.
- Data Processing & Cleaning - Raw data is messy. This step involves cleaning, formatting, and transforming data so it's accurate and usable.
- Analysis - The processed data is analyzed to identify patterns, trends, and anomalies. This can range from simple summaries to complex statistical modeling.
- Visualization & Reporting - Results are presented through dashboards, charts, graphs, and reports that make the insights easy to understand and act on.
The beauty of modern BI is that much of this process is automated. Once your data pipelines are set up, dashboards update in real time - giving you a living, breathing view of your business.
The Core Components of BI
Business intelligence isn't a single tool - it's an ecosystem. Here are the key pieces:
Data Warehousing
A data warehouse is the foundation of BI. It's a centralized repository where data from across your organization is stored in a structured, query-friendly format. Modern cloud warehouses like Snowflake, Google BigQuery, and Amazon Redshift have made this faster and more accessible than ever.
ETL and Data Integration
ETL stands for Extract, Transform, Load. These are the pipelines that pull data from your various systems, clean it up, and load it into your warehouse. Tools like Fivetran, Airbyte, and dbt handle this layer.
BI & Visualization Tools
This is the layer most people think of when they hear "business intelligence." Tools like Microsoft Power BI, Tableau, Looker, and ThoughtSpot let you build interactive dashboards, create reports, and explore data visually. This is where insights come to life.
Analytics & Reporting
Beyond visual dashboards, BI includes scheduled reports, automated alerts, and ad-hoc querying. The goal is to put information in front of the right people at the right time - whether that's a CEO checking morning metrics or a warehouse manager monitoring inventory levels.
Types of Business Intelligence
Not all BI is the same. Depending on what you're trying to accomplish, different types of BI serve different purposes:
- Descriptive Analytics - "What happened?" This is the most common form of BI. Sales reports, financial summaries, and operational dashboards all fall under descriptive analytics.
- Diagnostic Analytics - "Why did it happen?" This goes deeper, using drill-downs and data exploration to uncover the root causes behind trends.
- Predictive Analytics - "What will happen?" Using historical data and statistical models to forecast future outcomes. This is where BI starts to overlap with data science.
- Prescriptive Analytics - "What should we do?" The most advanced form, recommending specific actions based on data analysis.
Most organizations start with descriptive analytics and gradually move toward predictive and prescriptive as their data maturity grows. You don't need to jump to AI-powered forecasting on day one.
Business Intelligence Tools and Platforms
The BI tool landscape has matured significantly. Here's a practical overview of what's available:
BI & Visualization Platforms
- Microsoft Power BI - Deep integration with the Microsoft ecosystem. Excellent for organizations using Azure, SQL Server, and Microsoft 365. Offers strong self-service capabilities and enterprise governance.
- Tableau - Known for beautiful, highly customizable visualizations. Popular with data analysts who want maximum flexibility in how they present data.
- Looker - A Google Cloud product with a strong semantic layer. Ideal for organizations that want consistent definitions across all their data.
- ThoughtSpot - AI-powered search-driven analytics. Users can ask questions in natural language and get instant visualizations.
- Qlik - Offers associative analytics engine that lets users explore data relationships in ways traditional BI tools can't.
Data Platforms (The Foundation)
- Snowflake - Cloud data platform that separates compute from storage. Popular for its scalability and ease of use.
- Google BigQuery - Serverless, highly scalable data warehouse. Great for organizations already in the Google Cloud ecosystem.
- Amazon Redshift - AWS's data warehouse solution. Cost-effective for organizations with significant AWS investments.
- Microsoft Fabric - Microsoft's unified analytics platform that brings together data warehousing, data engineering, and BI.
Data Integration & Transformation
- Fivetran - Automated data integration. Connects to hundreds of data sources and syncs data into your warehouse.
- dbt - Data transformation tool that lets analysts write modular SQL to clean and prepare data for analysis.
- Airbyte - Open-source data integration platform. Good for teams that want more control over their data pipelines.
"The best BI tool is the one your team will actually use. A simpler tool that everyone adopts will always beat a powerful tool that nobody opens."
Real-World BI Examples
Let's make this concrete. Here's how different teams use business intelligence in practice:
Sales & Revenue
A sales director opens a dashboard each morning that shows pipeline value, deal velocity, win rates by region, and rep performance. Instead of waiting for a monthly report, they can see trends in real time and adjust territory assignments or coaching focus immediately.
Marketing
A marketing team tracks campaign ROI across channels - comparing the cost per lead from LinkedIn ads vs. Google Ads vs. organic search. They can see which content drives the most qualified traffic and reallocate budget accordingly.
Operations & Supply Chain
A manufacturing company monitors inventory levels across multiple warehouses. When a specific component drops below a threshold, the system triggers an alert. When demand spikes for a product, they can see it in the data before it becomes a stockout problem.
Finance
A CFO reviews a financial dashboard that consolidates data from multiple entities and currencies. Instead of spending days reconciling spreadsheets, they get a consolidated view of cash flow, expenses, and budget variance updated in real time.
Human Resources
An HR team tracks employee turnover, time-to-hire, and engagement scores across departments. They identify which teams have the highest attrition and investigate root causes before it becomes a talent crisis.
Business Intelligence vs Business Analytics
These terms are often used interchangeably, but there's a meaningful distinction:
- Business Intelligence focuses on what happened and what is happening now. It looks at historical and current data to inform decisions. Think dashboards, reports, and KPI tracking.
- Business Analytics focuses on why it happened and what will happen next. It uses statistical models, machine learning, and predictive techniques to forecast and optimize.
In practice, they overlap significantly. Most modern BI tools include analytics capabilities, and most analytics projects rely on BI infrastructure. The important thing isn't which label you use - it's making sure you have both capabilities available to your team.
Key Takeaway
BI tells you what's going on. Analytics tells you why and what's next. You need both to make truly data-driven decisions.
Why BI Matters for Your Business
Still wondering if BI is worth the investment? Here's what organizations typically gain:
- Faster decisions - When data is accessible and visual, leaders don't have to wait days or weeks for reports. They can make decisions in minutes.
- Reduced costs - BI highlights inefficiencies - whether it's overspending on a vendor, underutilizing equipment, or running marketing campaigns that don't convert.
- Revenue growth - By identifying your most profitable products, highest-value customers, and best-performing channels, BI helps you double down on what works.
- Better customer experience - Understanding customer behavior, preferences, and pain points lets you tailor experiences that keep people coming back.
- Competitive advantage - Companies that make decisions based on data consistently outperform those that rely on intuition. BI levels the playing field.
- Compliance & risk management - In regulated industries like finance and healthcare, BI helps maintain audit trails, track compliance metrics, and identify risks before they become problems.
How to Get Started with BI
You don't need to boil the ocean. Here's a practical roadmap for organizations that are just starting their BI journey:
- Identify your most critical questions - What decisions do your leaders make every week? What data would make those decisions easier? Start there.
- Consolidate your data - Get your data out of silos and into a central location. A cloud data warehouse is the modern approach, but even a well-organized set of databases is a start.
- Choose the right tool - Don't over-engineer this. A tool that matches your team's skills and your data maturity level will deliver more value than an enterprise platform you can't fully utilize.
- Start small, prove value - Build one or two dashboards that answer your most important questions. Use those wins to build momentum and secure buy-in for broader adoption.
- Invest in data literacy - The best BI platform is useless if nobody knows how to use it. Train your team, create a data-driven culture, and make data access a priority.
At Performalytic, we've helped hundreds of organizations navigate this journey - from selecting the right BI platform to building the data infrastructure that makes it all work. If you're ready to turn your data into a competitive advantage, let's talk.
Whether you're just starting out or looking to optimize an existing BI setup, our team can help you choose the right tools, build the right pipelines, and create the dashboards that actually move the needle.
Discover how 4DAlert enhances your BI infrastructure with automated data reconciliation and quality monitoring that keeps your dashboards accurate.