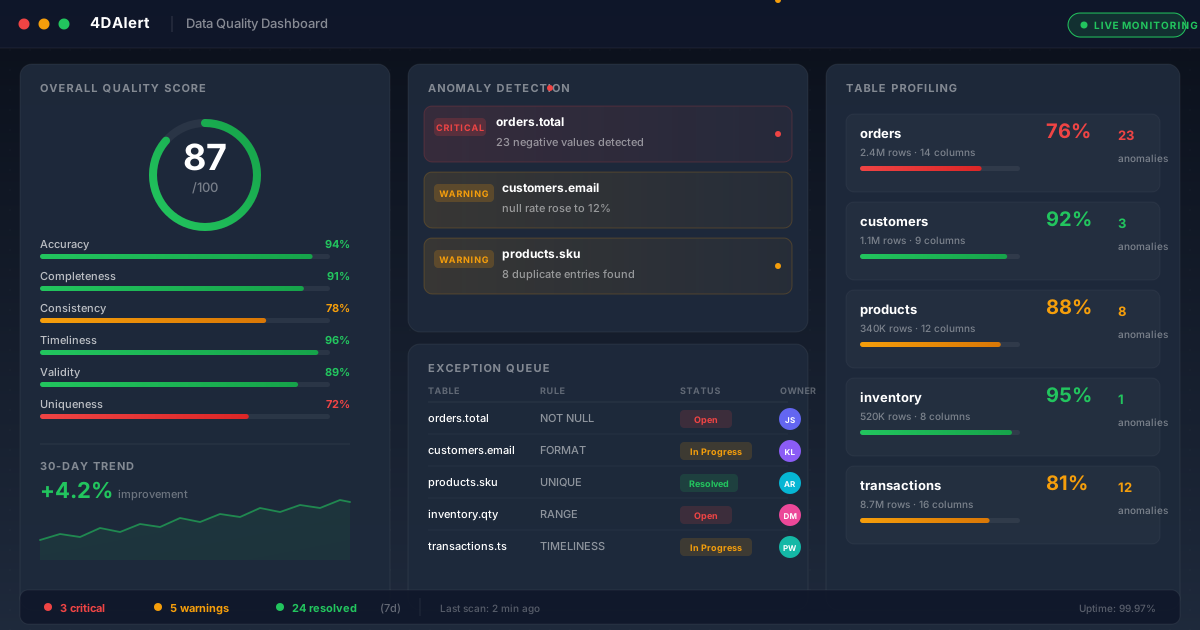
Every data leader has heard some version of this: "We know our data has quality issues, but we don't know how bad it is, where to start, or how to fix it systematically." It's the most common admission in our initial consultations — and it's completely understandable.
Data quality isn't a single problem you solve once. It's an ongoing practice that requires structure, tooling, and organizational commitment. Without a framework, teams end up firefighting individual issues without ever addressing the root causes. This guide walks through a practical, step-by-step approach to building a data quality framework that actually works.
1. Why You Need a Data Quality Framework
A data quality framework isn't a luxury for large enterprises — it's a necessity for any organization that makes decisions based on data. Without one, you're likely experiencing:
- Ad-hoc fixes: Data engineers spend 60-80% of their time on reactive data quality firefighting instead of building new capabilities
- Broken trust: Business users stop trusting dashboards and revert to spreadsheets, undermining your analytics investment
- Regulatory risk: Compliance requirements (GDPR, SOX, HIPAA) demand auditable data quality controls that manual processes can't provide
- AI failures: Machine learning models trained on bad data produce confidently wrong predictions
- Revenue leakage: Incorrect billing, duplicate records, and missing transactions silently drain revenue — studies show poor data quality causes 12% revenue loss on average
A framework transforms data quality from a collection of individual fixes into a systematic, measurable, and sustainable practice. For a deeper look at the financial impact, see our analysis of the real cost of bad data.
2. The Six Dimensions of Data Quality
Before building processes, you need to define what "quality" actually means for your organization. The industry-standard framework defines six dimensions:
The industry-standard six dimensions of data quality — define which of them matter for your organisation before you build any rules.
- Accuracy: Does the data correctly represent the real-world entity it describes? A customer's address should match their actual address.
- Completeness: Is all required data present? Missing email addresses, null phone numbers, or incomplete transaction records all fall here.
- Consistency: Is the data the same across all systems? If CRM says a customer is "Active" but the billing system says "Inactive," that's a consistency problem.
- Timeliness: Is the data available when it's needed? A dashboard showing yesterday's data might be fine; one showing last month's data might not be.
- Validity: Does the data conform to defined formats and rules? Dates should be dates, emails should match email format, amounts should be positive.
- Uniqueness: Are there unwanted duplicates? Duplicate customer records, repeated transactions, or overlapping entries inflate metrics and confuse analysis.
Not every dimension matters equally for every dataset. A marketing analytics table might prioritize completeness and timeliness, while a financial ledger demands accuracy and uniqueness. Start by mapping which dimensions matter most for your critical data assets.
3. Step 1: Assess Your Current State
Before you can improve data quality, you need to know how bad it actually is. Most teams are surprised by what they find.
Data profiling
Run automated profiling on your most critical datasets to understand:
- Null rates: What percentage of each column is null? Are there columns that should never be null but are?
- Distribution analysis: Are values distributed as expected, or are there unexpected spikes, gaps, or outliers?
- Pattern violations: How many email addresses don't match email format? How many phone numbers have fewer than 10 digits?
- Cross-column dependencies: Does end_date always come after start_date? Are total amounts consistent with line items?
Cross-system comparison
Compare critical data across systems to find inconsistencies. If your CRM says you have 10,000 active customers but your billing system shows 8,500 — that's 1,500 records that need investigation. For a practical approach to this, see our guide to automated data reconciliation.
Stakeholder interviews
Talk to the people who actually use the data. Ask them: Where do you lose trust in the data? What breaks most often? Which reports do you manually verify before presenting? Their answers will tell you where quality matters most.
"You can't improve what you can't measure. The first step in any data quality framework is honest assessment — and most teams are shocked by what they find."
4. Step 2: Define Quality Rules and Thresholds
Once you know the current state, you need rules that define what "good" looks like. Rules should be specific, measurable, and tied to business impact.
Types of rules to define
- Schema rules: Column types, nullability, allowed values (e.g., status must be one of: active, inactive, pending)
- Statistical rules: Value distributions, freshness thresholds, volume expectations (e.g., daily order count should be between 500-5,000)
- Business rules: Domain-specific validations (e.g., discount percentage should never exceed 50%, shipping date must be after order date)
- Cross-system rules: Consistency checks between systems (e.g., customer count in CRM should match billing system within 5%)
Setting thresholds
Not every quality issue deserves an alert. Set thresholds based on business impact:
- Critical: Data issues that will cause incorrect decisions or financial loss (e.g., wrong amounts in financial reports) — alert immediately
- Warning: Issues that degrade quality but don't break anything yet (e.g., rising null rate on an optional field) — alert within 24 hours
- Informational: Minor deviations worth tracking but not acting on immediately (e.g., slight distribution shift) — log for weekly review
5. Step 3: Implement Automated Monitoring
Manual data quality checks don't scale. You need automated monitoring that runs continuously and alerts the right people when thresholds are breached.
What to automate
- Rule execution: Run all quality rules on a defined schedule (real-time for critical data, hourly or daily for less time-sensitive data)
- Anomaly detection: Automatically detect unexpected changes in data patterns — volume drops, distribution shifts, new null patterns
- Alert routing: Send alerts to the right team based on severity, data domain, and ownership
- Trend tracking: Track quality scores over time to identify improving or degrading trends
Where to implement monitoring
Quality checks should be layered across your data pipeline:
- Ingestion layer: Validate data as it enters your system — catch source-side issues before they propagate
- Transformation layer: Check data after transformations — ensure business logic is applied correctly
- Consumption layer: Monitor data at the point of use — dashboards, reports, and APIs that business users depend on
For more on building reliable data pipelines, see our DevOps best practices for data teams.
6. Step 4: Build an Exception Management Workflow
Detecting quality issues is only half the equation. You also need a structured process for resolving them. Without a workflow, alerts pile up, issues get deprioritized, and quality degrades.
The exception workflow
- Detection: Automated monitoring identifies a quality issue and generates an alert
- Classification: Determine severity, assign ownership, and prioritize based on business impact
- Investigation: Root cause analysis — is this a source issue, transformation bug, or schema change?
- Resolution: Fix the issue, whether that means updating source data, correcting transformation logic, or notifying a data provider
- Verification: Confirm the fix resolved the issue and quality metrics return to acceptable levels
- Documentation: Record what happened, why, and what was done to prevent recurrence
7. Step 5: Establish Ownership and Culture
The most sophisticated monitoring tool in the world won't help if nobody owns data quality. This is where most frameworks fail — they focus on technology and ignore the organizational side.
Define clear ownership
- Data owners: Senior stakeholders accountable for the quality of specific data domains (e.g., VP of Sales owns customer data)
- Data stewards: Day-to-day responsibility for monitoring quality, resolving exceptions, and maintaining rules
- Data engineers: Technical responsibility for implementing and maintaining quality checks in the pipeline
Build quality into culture
- Make quality visible: Publish data quality dashboards so everyone can see the current state
- Tie quality to outcomes: Connect data quality metrics to business KPIs — show how quality improvements drive better decisions
- Celebrate improvements: Recognize teams that improve quality, not just those who ship features
- Blameless post-mortems: When quality issues cause outages, focus on system improvements, not individual blame
8. How 4DAlert Accelerates Your Framework
Building a data quality framework from scratch is possible — but it takes months of engineering effort to build the monitoring, alerting, exception management, and reporting infrastructure. 4DAlert provides all of this as a ready-made platform, so your team can focus on defining rules and resolving issues rather than building tooling.
What 4DAlert provides
- Automated data profiling: Profile datasets across SQL Server, PostgreSQL, Oracle, Snowflake, and other databases — understand null rates, distributions, patterns, and anomalies without writing custom scripts
- Rule-based validation: Define quality rules through a visual interface or SQL, with built-in support for schema rules, statistical rules, business rules, and cross-system reconciliation
- Cross-system reconciliation: Compare data across multiple databases and environments to find inconsistencies — critical for organizations with hybrid or multi-cloud architectures
- Exception management: Structured workflows for classifying, assigning, tracking, and resolving quality issues — with SLA tracking and escalation
- Quality dashboards: Real-time visibility into data quality scores across all monitored datasets, with drill-down into specific issues
- Alerting: Route alerts to the right people via Slack, email, or PagerDuty based on severity, data domain, and ownership
Instead of spending 3-6 months building monitoring infrastructure, teams using 4DAlert typically have their framework operational within weeks. For teams also managing schema changes, 4DAlert's schema CI/CD pairs naturally with data quality monitoring.
9. AI-Powered Data Quality in 4DAlert
Traditional data quality tools rely entirely on rules you define manually. You tell the system what to check, what thresholds to use, and when to alert. This works for known problems — but most data quality issues aren't known in advance. This is where AI-powered data quality changes the game.
4DAlert integrates AI across the entire data quality lifecycle, moving beyond rule-based checks to intelligent, adaptive quality management.
AI-driven anomaly detection
Rather than requiring you to define every possible anomaly, 4DAlert's AI models learn the normal behavior of your data and flag deviations automatically:
- Volume anomalies: Detects unexpected drops or spikes in row counts — a sudden 40% decrease in daily orders, a 3x spike in signups that doesn't match marketing activity
- Distribution anomalies: Identifies when value distributions shift unexpectedly — average order value jumping from $85 to $240 overnight, or a new state appearing in a location column
- Pattern anomalies: Catches subtle pattern changes that rules miss — email formats shifting to include international domains, phone numbers changing length after a source system update
- Temporal anomalies: Recognizes time-based patterns and flags deviations — data that normally arrives by 6 AM arriving at noon, weekend data volumes that look like weekday volumes
The AI continuously learns from your data, so its understanding of "normal" evolves as your business changes. You don't need to manually update thresholds every quarter.
Intelligent root cause analysis
When a quality issue is detected, the hardest part isn't finding it — it's understanding why it happened. 4DAlert's AI assists with root cause analysis by:
- Correlation analysis: Automatically correlating quality issues with recent changes — schema modifications, deployment events, source system updates, or pipeline changes
- Impact propagation tracking: Tracing how a quality issue in one table flows downstream to affected dashboards, reports, and dependent datasets
- Suggested remediation: Based on historical patterns and similar past issues, the AI suggests potential fixes — "This null rate spike is consistent with a source system API change observed on March 12th"
Adaptive thresholds and self-tuning rules
Static thresholds are the Achilles' heel of traditional data quality. Set them too tight and you get alert fatigue. Set them too loose and real issues slip through. 4DAlert's AI solves this with adaptive thresholds that:
- Learn seasonal patterns: Understand that Q4 order volumes are 3x Q1, so a "spike" in November isn't an anomaly
- Adjust for growth: Automatically tighten or loosen thresholds as your data grows — a 5% null rate might be normal for a startup but unacceptable for an enterprise
- Reduce false positives: By learning what's actually normal for your specific data, the AI dramatically reduces the noise that causes alert fatigue — teams using 4DAlert report a 60-70% reduction in false positive alerts
Natural language data quality insights
Data quality dashboards are useful, but sometimes you need a quick answer without interpreting charts. 4DAlert's AI generates natural language summaries of your data quality state:
- Daily briefings: "Data quality score improved 2.3% overnight. The orders table anomaly from yesterday has been resolved. One new warning: customers.email null rate increased to 8.2%, up from 6.1% last week."
- Trend explanations: "Uniqueness score has declined 5% over the past 14 days, driven primarily by duplicate product records introduced by the new vendor import pipeline."
- Actionable recommendations: "3 tables have quality scores below your 85% threshold. Prioritized by business impact: orders (76%, affects revenue reporting), transactions (81%, affects reconciliation), products (88%, affects inventory accuracy)."
AI-assisted rule creation
One of the biggest barriers to data quality is the cold start problem — you know you need rules, but writing hundreds of validation rules from scratch is overwhelming. 4DAlert's AI helps by:
- Auto-generating rules from profiling: After profiling a dataset, the AI suggests rules based on what it observed — "Column 'age' has values ranging from -5 to 150. Suggested rule: age BETWEEN 0 AND 120"
- Cross-table relationship detection: Automatically identifies foreign key-like relationships between tables and suggests referential integrity checks
- Business rule inference: Learns patterns from existing data and suggests rules — "Order amounts are always positive. Suggested rule: total > 0"
Predictive quality scoring
Beyond detecting current issues, 4DAlert's AI can predict future quality problems before they occur:
- Trend forecasting: "At the current rate of increase, orders.total null rate will breach your 5% threshold within 12 days"
- Capacity-based prediction: "Based on current ingestion volumes, your data freshness SLA will be at risk during next month's promotional period"
- Source health scoring: "Source system 'vendor_api' has shown declining data quality for 3 consecutive weeks. Recommend proactive outreach to vendor."
"The shift from reactive to predictive data quality is the single biggest advancement in how organizations manage data. When you can predict a quality issue before it happens, you move from firefighting to prevention."
For a deeper look at how AI is transforming data quality beyond just monitoring, see our analysis of AI-native data quality with knowledge graphs and MCP.
10. Common Pitfalls to Avoid
Based on working with dozens of enterprise data quality initiatives, here are the most common mistakes:
- Starting with tools instead of problems: Don't buy a platform and then look for problems to solve. Start with the business problems, then find the right tools
- Testing everything equally: Not every dataset deserves the same quality investment. Focus on the data that drives critical decisions
- Ignoring the human element: The best monitoring in the world is useless if alerts go unactioned. Invest in ownership and workflows
- Setting thresholds too tightly: Overly strict rules generate noise and alert fatigue. Start with reasonable thresholds and tighten gradually
- Forgetting about historical data: Quality checks on new data are important, but don't forget to assess and remediate existing data
- Treating quality as a one-time project: Data quality is a continuous practice, not a project with an end date
Getting Started
A data quality framework doesn't have to be a massive, multi-year initiative. Start small, prove value, and expand:
- Pick one critical dataset: Choose the dataset that causes the most pain — the one that generates the most support tickets or drives the most important decisions
- Profile it honestly: Run automated profiling to understand the current state. Don't sugarcoat the results
- Define 5-10 rules: Start with the most impactful rules — the ones that catch issues that actually matter to the business
- Set up monitoring: Use a platform like 4DAlert with its AI-powered anomaly detection, or build basic monitoring with your existing tools
- Establish a review cadence: Weekly quality review meetings (15 minutes max) to review scores, exceptions, and improvements
- Expand gradually: As you prove value on one dataset, extend the framework to additional datasets and domains
The goal isn't perfection — it's progress. A framework that catches 80% of quality issues on your most critical dataset is infinitely more valuable than a perfect framework that never gets implemented.