Here's a scene that plays out in enterprises every single day: the VP of Marketing reports that customer acquisition cost dropped 12% this quarter. The CFO's report shows it went up 3%. Both are looking at the same metric. Both believe their number is correct. Both are working from the same source data.
The difference? They're using different definitions of "cost," different attribution windows, and different calculations for what counts as "acquired." The data is clean. The pipeline is reliable. But the semantics are broken.
This is the data modeling crisis. A recent industry survey found that 89% of data teams report significant challenges with semantic consistency across their organizations. The problem isn't data quality - it's data meaning. And it's quietly undermining trust in analytics across the enterprise.
Table of Contents
- The Semantic Layer Problem: Same Words, Different Meanings
- The "Move Fast" vs "Model Right" Tension
- Data Modeling Approaches: Choosing Your Path
- How AI Both Creates and Solves the Crisis
- A Practical Framework for Semantic Consistency
- The Cost of Doing Nothing
- Getting Started: Your Next 30 Days
- Frequently Asked Questions
The Semantic Layer Problem: Same Words, Different Meanings
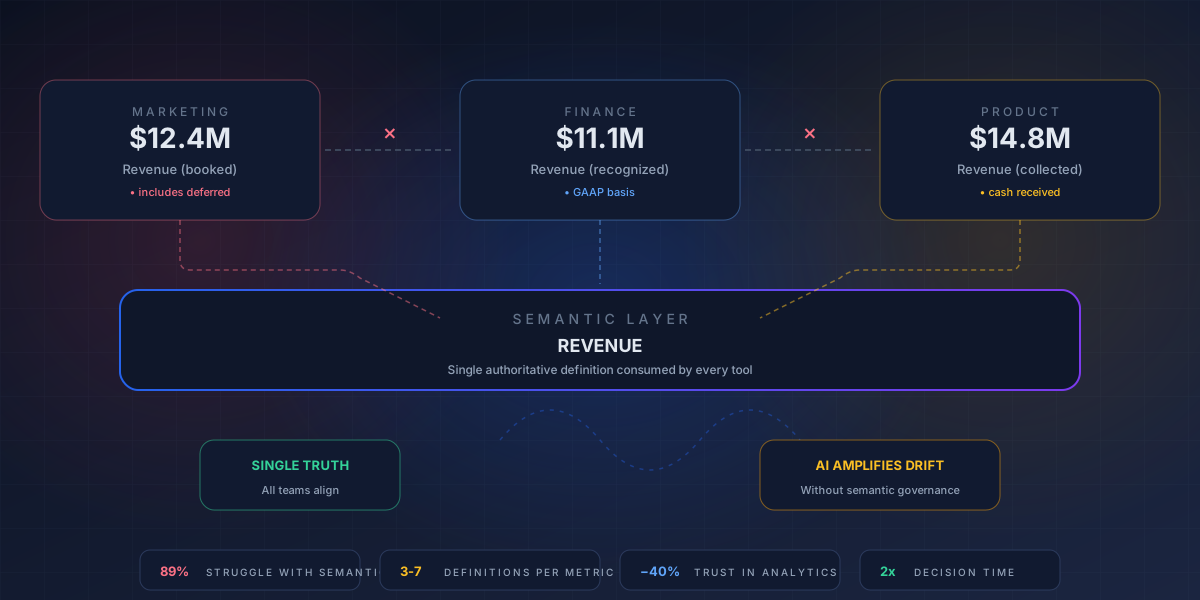
At the heart of the crisis is a simple but profound problem: organizations have no single source of truth for what their metrics actually mean. "Revenue" might mean booked revenue, recognized revenue, or collected revenue depending on who you ask. "Active user" could mean anyone who logged in once in the past 30 days, or someone who completed a key action. "Churn rate" varies so widely that comparing two companies' churn numbers is almost meaningless.
When every tool defines its own metrics, the same name computes differently everywhere — a shared semantic layer between raw data and BI tools is what makes one number stay one number.
The traditional approach has been to define metrics in BI tools. But that creates a new problem: every tool has its own definition, and there's no way to enforce consistency across Looker, Tableau, Power BI, and your data warehouse. The result is a proliferation of "one-off" metrics that look the same but compute differently. This is why an enterprise BI integration strategy must include a semantic layer from day one.
This is where the semantic layer comes in. A semantic layer is a centralized representation of business metrics and dimensions that sits between your raw data and your analytics tools. Instead of each dashboard defining "revenue" independently, the semantic layer provides a single, authoritative definition that every tool consumes consistently.
"The semantic layer isn't just a technical solution - it's an organizational one. It forces you to have the hard conversations about what your metrics actually mean."
The "Move Fast" vs "Model Right" Tension
Data teams operate under constant pressure to deliver insights quickly. Business stakeholders want dashboards yesterday. This creates an inevitable tension between speed and structure:
- Move fast: Skip the modeling step, write SQL directly against raw tables, and get the answer out the door. Fast to deliver, but every query is a snowflake - no reusability, no consistency, no governance.
- Model right: Invest in proper data modeling, build conformed dimensions, define metrics once. Slower to start, but dramatically faster and more reliable over time.
The analytics engineering movement - led by tools like dbt - tried to bridge this gap by bringing software engineering best practices to data transformation. And it worked, to a degree. Teams could now version-control their transformations, test their data, and document their pipelines. But dbt alone doesn't solve the semantic problem - which is why our data reconciliation guide emphasizes that tooling without governance still leads to drift. It gives you better tools for building models, but it doesn't tell you what the models should mean.
The real breakthrough is dbt's Semantic Model, introduced in dbt 1.8. This allows teams to define metrics and dimensions declaratively within their dbt project, creating a portable semantic layer that can be consumed by any tool that supports the MetricFlow protocol. It's a significant step forward, but it requires teams to invest in the upfront work of defining metrics rigorously - something many organizations still struggle with.
Data Modeling Approaches: Choosing Your Path
The data modeling crisis isn't just about tools - it's about methodology. How you model your data determines how easy or hard it is to maintain semantic consistency. Let's look at the major approaches:
Kimball (Dimensional Modeling)
The gold standard for analytics. Kimball's star schemas with conformed dimensions provide a proven framework for semantic consistency. When every fact table joins to the same "customer" or "date" dimension, you naturally get consistent answers. The tradeoff? Dimensional models require significant upfront design work and can be rigid to change.
Inmon (Normalized EDW)
A normalized enterprise data warehouse that prioritizes data integrity and eliminates redundancy. Inmon models are semantically rigorous but can be complex to query for analytics, requiring additional denormalization layers for BI consumption.
Data Vault
Designed for agility and auditability, Data Vault separates hubs (business keys), links (relationships), and satellites (attributes). It's excellent for handling changing source systems and maintaining historical accuracy, but it adds architectural complexity and requires careful governance to maintain semantic clarity.
One Big Table (OBT)
The modern analytics stack trend: denormalize everything into a single wide table and let analysts query directly. Fast and simple, but semantically fragile - any change to business logic requires rebuilding the entire table, and there's no shared dimension structure to enforce consistency.
There's no single "right" approach. The best data modeling strategy depends on your organization's size, complexity, regulatory requirements, and analytical maturity. But every approach requires an investment in semantic consistency to be successful.
How AI Both Creates and Solves the Crisis
Artificial intelligence is a double-edged sword in the data modeling crisis. Here's how it makes the problem worse - and how it can help solve it.
How AI Makes It Worse
AI-powered analytics tools - from natural language querying to automated insights - amplify semantic inconsistency. When a BI tool allows executives to ask "what's our revenue?" in natural language, it needs to know which definition of revenue to use. Without a semantic layer, the AI has to guess - and it will guess differently depending on context, training data, or even the phrasing of the question.
AI agents that generate SQL or build dashboards autonomously make this even more dangerous. An AI agent doesn't know that "revenue" means different things to different teams. It will happily generate a query using whatever table or column name looks relevant, producing a confident but wrong answer. As AI adoption grows, the cost of semantic inconsistency grows exponentially.
How AI Can Help Solve It
AI can also be part of the solution. Here's how forward-thinking teams are using AI to address the data modeling crisis:
- Automated semantic discovery: AI can analyze existing queries, dashboards, and data dictionaries to identify where different teams are using the same terms with different definitions. This gives you a concrete map of semantic drift across your organization.
- Metric recommendation: When teams define new metrics, AI can suggest standardized definitions based on industry benchmarks, your existing metric catalog, and the shape of your data.
- Semantic validation: AI can review SQL queries and flag potential semantic inconsistencies - spotting when a query uses "revenue" from the wrong table or joins on a non-conformed dimension.
- Natural language to semantic query: Instead of guessing, AI-powered BI tools can resolve natural language questions against a semantic layer, ensuring that "what's our revenue?" always returns the organizationally agreed-upon answer.
The organizations that will thrive in the AI era are the ones that invest in semantic consistency now, before the AI amplification effect makes the crisis unmanageable. This is where AI-ready data infrastructure becomes a competitive necessity.
A Practical Framework for Semantic Consistency
Fixing the data modeling crisis doesn't require a multi-year transformation. Here's a practical roadmap:
- Audit your metric definitions - Catalog every metric used across your organization and document where definitions diverge. You'll likely find 3-7 different definitions of "revenue" alone.
- Establish metric governance - Create a lightweight governance board with stakeholders from finance, marketing, product, and operations. Their job isn't to approve every metric - it's to agree on the definitions of the 20-30 most critical metrics that drive executive decisions.
- Build a semantic layer - Implement a semantic layer using tools like dbt Semantic Model, Looker's LookML, or AtScale. Start with your critical metrics and expand from there.
- Integrate with your BI stack - Connect your semantic layer to all your analytics tools so that every dashboard consumes metrics from the same authoritative definitions.
- Automate semantic validation - Use automated tests to detect when new queries or models introduce semantic drift. Treat semantic consistency the same way you treat data quality.
- Measure semantic health - Track metrics like "metric divergence rate" (how many definitions exist per metric) and "semantic coverage" (what percentage of dashboards use governed metrics).
The Cost of Doing Nothing
The data modeling crisis is compounding. Every new dashboard, every new AI agent, every new data source adds to the semantic entropy. Without intervention, the problem doesn't stabilize - it accelerates. Two years from now, you won't have fewer metric definitions. You'll have more.
Meanwhile, the business impact is real and measurable - and it directly undermines your ability to make data-driven decisions:
- Slow decision-making: Every disagreement over "the right number" delays decisions by days or weeks while teams reconcile their definitions.
- Eroded trust: When executives get conflicting numbers, they stop trusting analytics entirely and revert to gut decisions.
- Wasted engineering time: Data engineers spend countless hours reconciling metric definitions across teams instead of building new capabilities.
- AI failures: As AI agents proliferate, semantic inconsistency will become a liability rather than an asset.
"The data modeling crisis isn't a technology problem. It's a language problem. And like any language problem, the only way to solve it is to get people in a room and agree on what words mean."
Getting Started: Your Next 30 Days
Here's what you can do this month to start addressing the data modeling crisis:
Week 1: Identify your top 10 most-used metrics. Interview 3-5 stakeholders who use each metric and document how their definitions differ.
Week 2: Convene a 90-minute session with stakeholders to agree on canonical definitions for the top 5 metrics. Expect healthy debate - that's the point.
Week 3: Implement those definitions in a semantic layer. Even a simple YAML-based approach in dbt is a massive improvement over having no central definitions.
Week 4: Connect your primary BI tool to the semantic layer and retire the old, inconsistent metric definitions. Measure how many dashboards were affected.
From there, expand iteratively. The goal isn't to model everything at once - it's to achieve critical mass where the semantic layer becomes the path of least resistance for defining new metrics.
Frequently Asked Questions About the Data Modeling Crisis
What is the data modeling crisis?
The data modeling crisis refers to the growing challenge where organizations lack a single source of truth for what their business metrics mean. Different teams define the same metric differently - for example, "revenue" might mean booked, recognized, or collected revenue depending on who you ask. A recent industry survey found that 89% of data teams report significant challenges with semantic consistency.
What is a semantic layer in data modeling?
A semantic layer is a centralized representation of business metrics and dimensions that sits between your raw data and your analytics tools. Instead of each dashboard defining metrics independently, the semantic layer provides single, authoritative definitions that every BI tool - Looker, Tableau, Power BI - consumes consistently. This is a core component of modern BI integration architecture.
How does dbt Semantic Model help?
dbt's Semantic Model, introduced in dbt 1.8, allows teams to define metrics and dimensions declaratively within their dbt project. It creates a portable semantic layer that any tool supporting the MetricFlow protocol can consume, making it much easier to maintain consistent definitions across your analytics stack.
What's the best data modeling methodology?
There's no single "right" approach. Kimball (dimensional modeling) is the gold standard for analytics. Inmon prioritizes data integrity through normalization. Data Vault offers superior auditability and handles source system changes well. One Big Table is fast but semantically fragile. The right choice depends on your organization's size, complexity, and analytical maturity.
Can AI solve the data modeling crisis?
AI is a double-edged sword. AI-powered analytics tools amplify semantic inconsistency when there's no semantic layer to govern them. But AI can also help through automated semantic discovery (finding where definitions diverge), metric recommendation, semantic validation of SQL queries, and natural language interfaces that resolve questions against governed metric definitions. For more on AI in analytics, see our guide on AI-ready data infrastructure.
How long does it take to fix semantic inconsistency?
The 30-day framework outlined above provides a fast path: week 1 for discovery, week 2 for stakeholder alignment, week 3 for semantic layer implementation, and week 4 for BI integration. Most organizations see meaningful improvement within 60-90 days by following this iterative approach.
At Performalytic, we help enterprises navigate the data modeling crisis with practical, results-oriented approaches. Our team combines deep expertise in data architecture, semantic layer implementation, and AI-ready data infrastructure to help organizations achieve semantic consistency at scale. Schedule a consultation to learn how we can help your team stop arguing about what the numbers mean and start using them to make better decisions.
See how 4DAlert ensures semantic consistency with automated data reconciliation and quality validation across your analytics stack.